The following is a “lessons learned from the past” type of article. This particular incident occurred between 2014 and 2015. But it goes to show how something small can have a very large unintended consequence…
Environment:
- Citrix XenApp 6.5 on Windows Server 2008 R2
- Approximately 700 concurrent users running 1 published desktop
- Windows Server 2008 R2 File Server, backed by Hybrid SAN (Tegile 2300)
- Running on ESXi 5.5
- Use Norskale VUEM to handle Citrix UPM and Folder Redirection
- Using streaming profiles w/ Active write back from the file server (FS3)
- Redirecting AppData to the file server (FS3)
- UPM and AppData on separate volumes, separate PVSCSI adapters
Symptoms:
- At approximately 10am local time, users would start seeing a mysterious slow-down of the system. This affected all users of our published desktop.
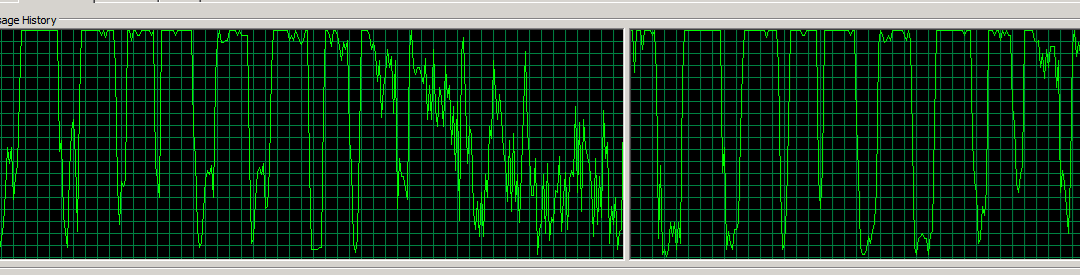
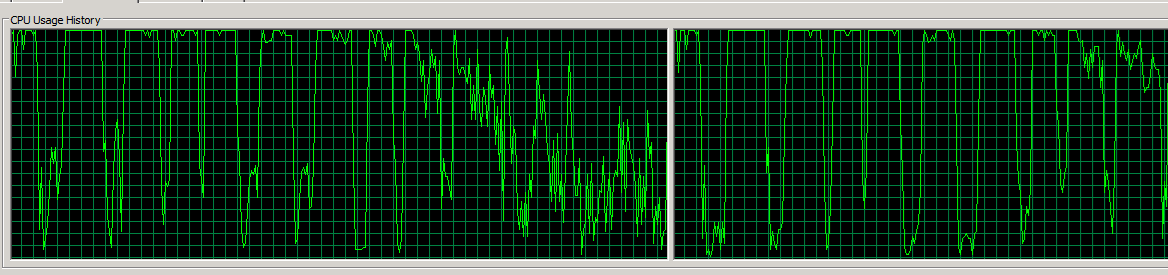
- At the same time, the processor utilization on FS3 would spike to 100% (2vCPU) for ~15 seconds, then drop to 10% for 5 seconds, then repeat. It looked like this:
Back Story:
This problem caused us to migrate FS3 to Windows Server 2012 R2, after opening a case with MS Performance Team, which stumped them for a week. We built a brand new 2012 R2 VM, 2 vCPU, 32GB RAM, VMXNET3 adapter, PVSCSI adapters, and detached the data volume from FS3 and reattached to FS2 (new VM). This “solved” our problem for nearly a week. Then it started back up again, with the exact same symptoms. So, we started looking deeper. VMware was OK underneath the covers – ESXTop showed that everything was good. The SAN was good.
Except it wasn’t. And our users let us know.
Solution:
A month prior to this issue, we upgraded from IE9 to IE11 on our XenApp 6.5 farm. However, we continued to stay at UPM 4.1.2.2. Normally this wouldn’t be an issue, but we had Folder Mirroring enabled for the AppData\Roaming\Microsoft\Windows\Cookies folder and the option to Process Internet cookies on logoff enabled. This worked very well with IE9. Not so much for IE11. I turned off the folder mirroring and process cookies at logoff, and our file server performance issue disappeared. (NOTE: folder mirroring for IE cookies should only be enabled when UPM with Streaming is enabled, and is not necessary when AppData is being redirected. I’m not sure why it was ever turned on, even though I’m definitely the one who did it.)
How we found the cause (or, Our Troubleshooting Procedure):
Over the past several weeks as I’ve been head deep in Resource Monitor on the file server, I’ve been noticing that the cookies.txt files are NUMEROUS and that the latencies on them seemed abnormally high. So that got me thinking, and I did some research and came across a couple Citrix Blogs about UPM and IE 11 and cookies (links?). But I noticed that all of the blogs were talking about UPM 5.x, so I did a quick look and saw that we were still on 4.x. I also recalled that this really started coming to a head at the end of last month, which was right around the time we upgraded from IE9 to IE11 (it had been mildly bad before then).
We had migrated all of our users from the redirected AppData to local profile (UPM), and the file server was still being hammered. I recommended a reboot this morning to help, while still researching, and found that our version of Windows Server 2012 R2 does not have the latest update, which has a hotfix for a memory leak with files copied over SMB shares – which is exactly what we do with this server. Upon rebooting, the system immediately started acting similarly, so I knew it wasn’t the memory leak directly – and then I noticed the cookies.txt files showing the super high latencies again. I had suspected this prior, but now I was mostly convinced that this was the issue, so I disabled the folder mirroring and syncing on logoff, and within a minute noticed an improvement via our ExtraHop console. The issue – upgrading to IE11 while keeping a version of UPM that did not support IE11 was a bad idea. Lesson learned, do the due diligence when making sweeping changes.
<Update on 27 January 2017>
So what was going on? Let me be a bit more specific about what was happening, and why. When we redirected our AppData folder, this included the IE folders, such as Cookies and History. Setting up Cookies to be mirrored meant that any time a cookie was accessed, updated, or added locally it was synced back to the file server. This caused the file server to be constantly scanning these folders for changes. The file scanning was causing the performance impact.
We noticed a similar impact when redirecting the Favorites folder to a file server. This is also a bad idea. Every time that IE loads a page, it rescans the entire favorites folder structure. So, 700+ users at lunch time all surfing the web are enough to bring a fairly beefy file server to its knees.
</Update>
Over the course of the next 20 minutes, it settled down completely, and the system has been fast and stable since then. I used ExtraHop to show what was going on, which is INVALUABLE, even the free version I’m running (which is no longer available). I HIGHLY recommend anyone who runs a Citrix / VDI / RDSH environment look at it and put it in your toolbox – it’s not even that expensive. It installs as an appliance (virtual or physical), and takes about 15 minutes to setup. Here’s some of the graphs I’ve gotten from it, see if you can tell when I disabled the folder mirroring…
<Author’s note>
The below screenshots were taken at the time I wrote this article for my internal staff and other Citrix admin friends. We were running ExtraHop Discovery Edition VM, which no longer exists. The new ExtraHop console is WAY cooler. Give it a look here: https://www.extrahop.com. They have a free online demo, so you can kick the tires.
</Author’s note>
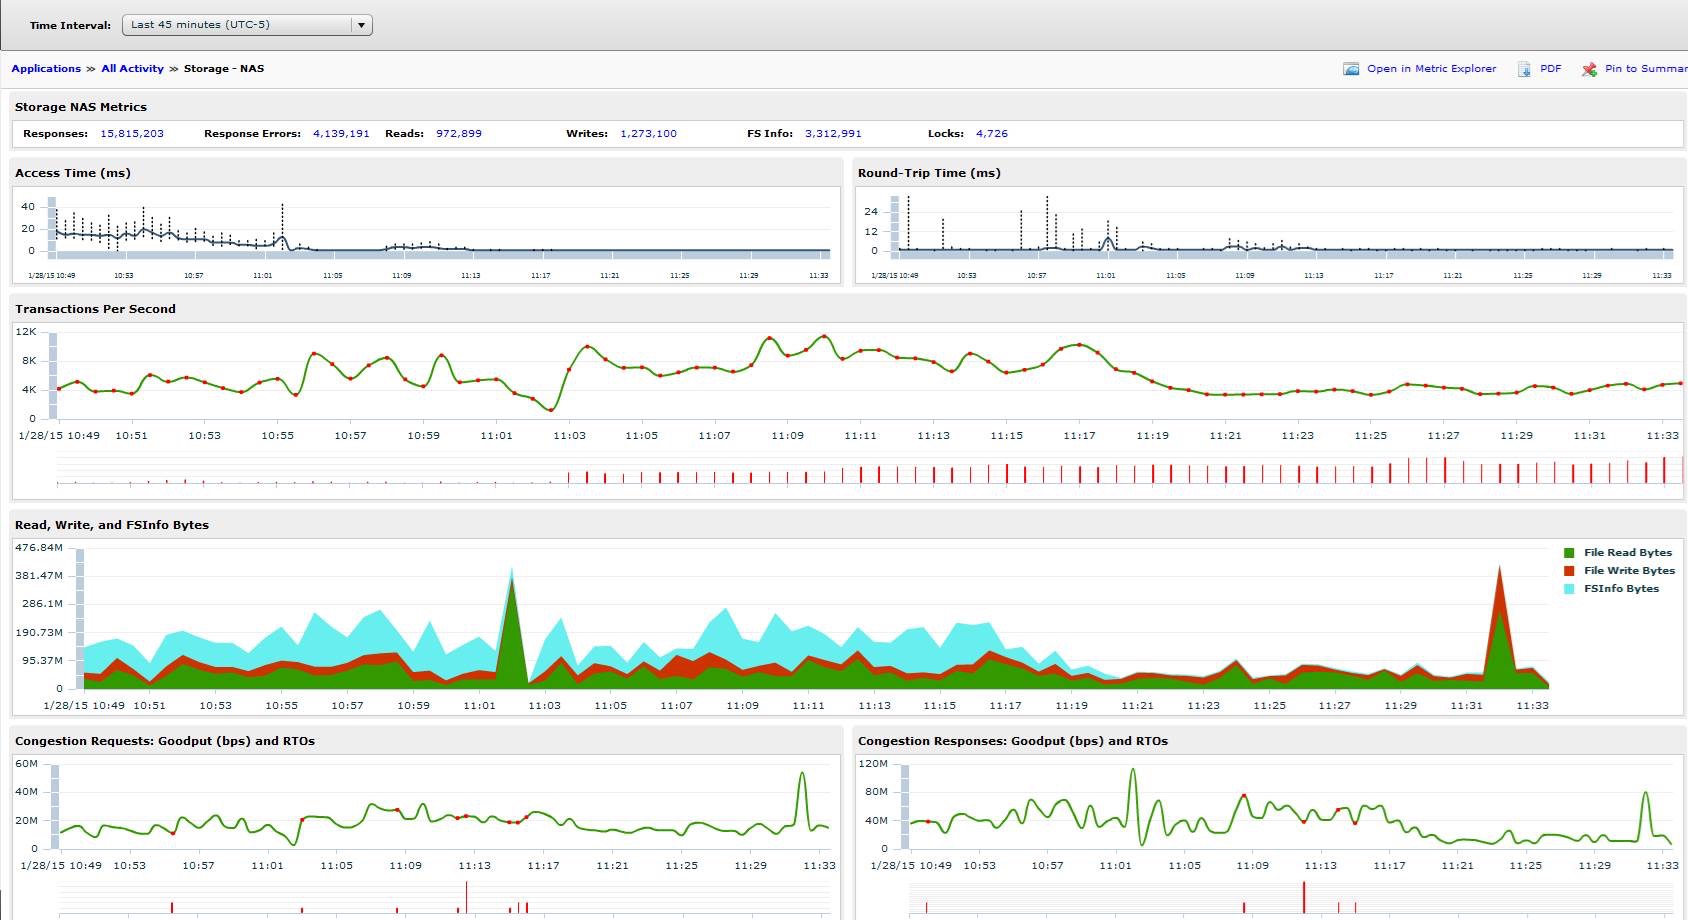
Here is what all of yesterday’s data looked like:
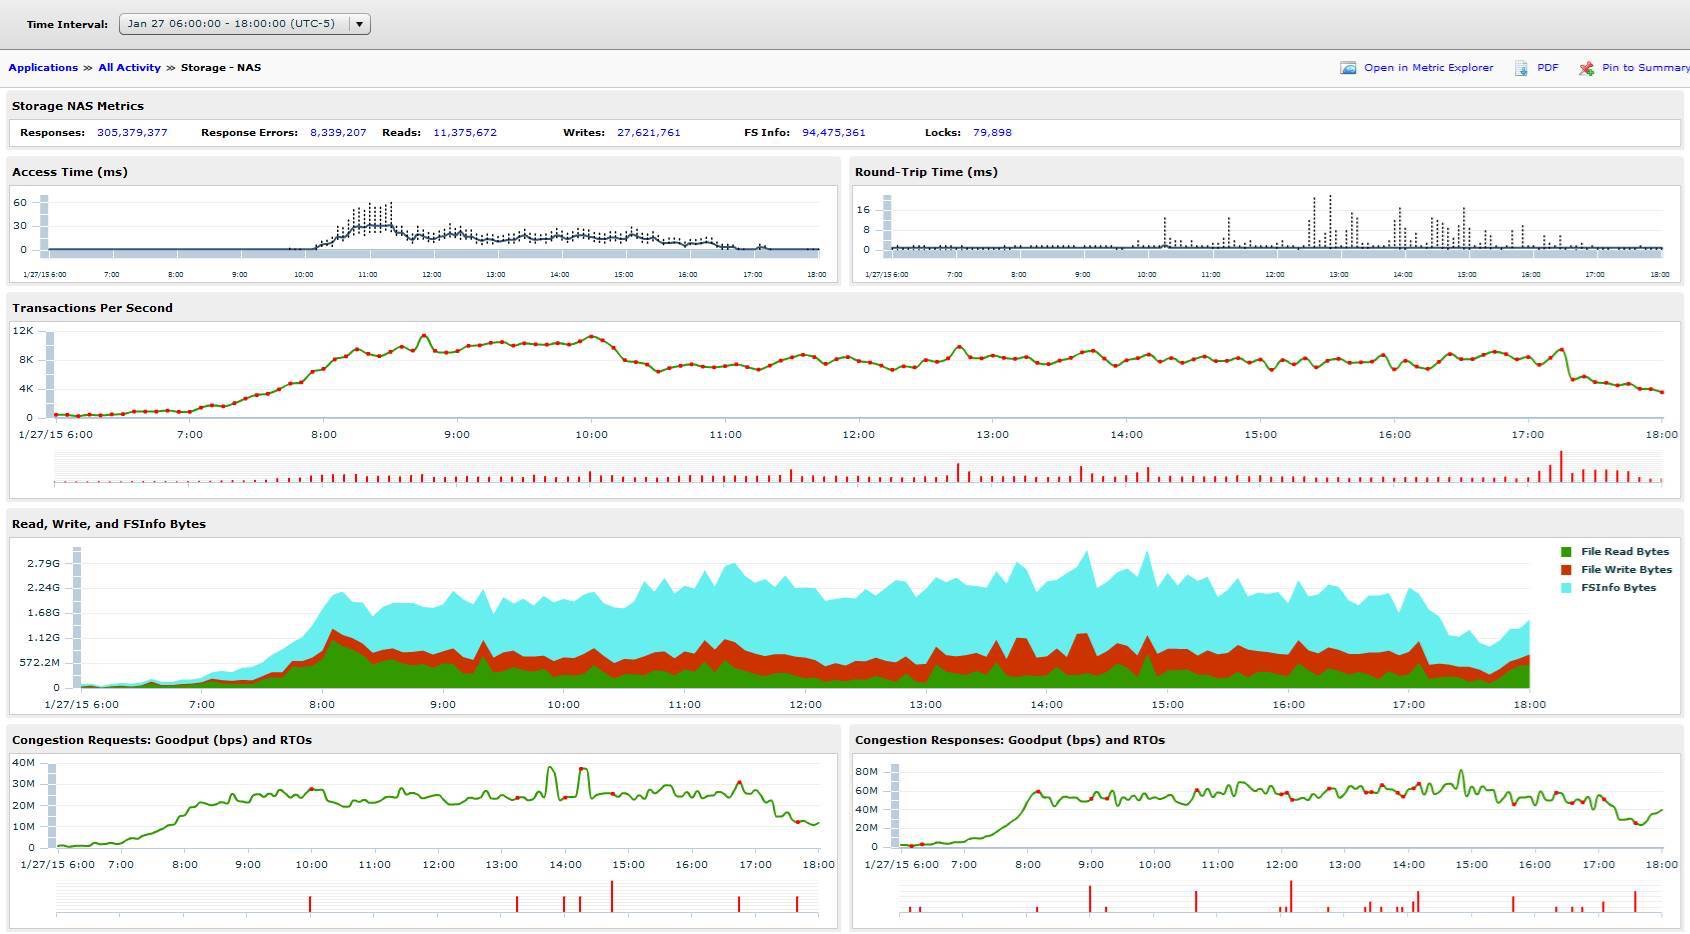
Let me call out some of the areas.
- Access time during day hours is normally > 30ms. This is BAD.
- Round trip time is low.
- Transactions per second is 8,000 > x > 12,000. This is for User Profiles (redirected AppData mostly) only. For 700 users. Ouch.
- The blue background under Read, Write, FSInfo Bytes is the FSInfo Bytes. Digging into this, this appears to be metadata associated with the files being transferred. This was what originally caught my eye.
- Goodput / congestion look good.
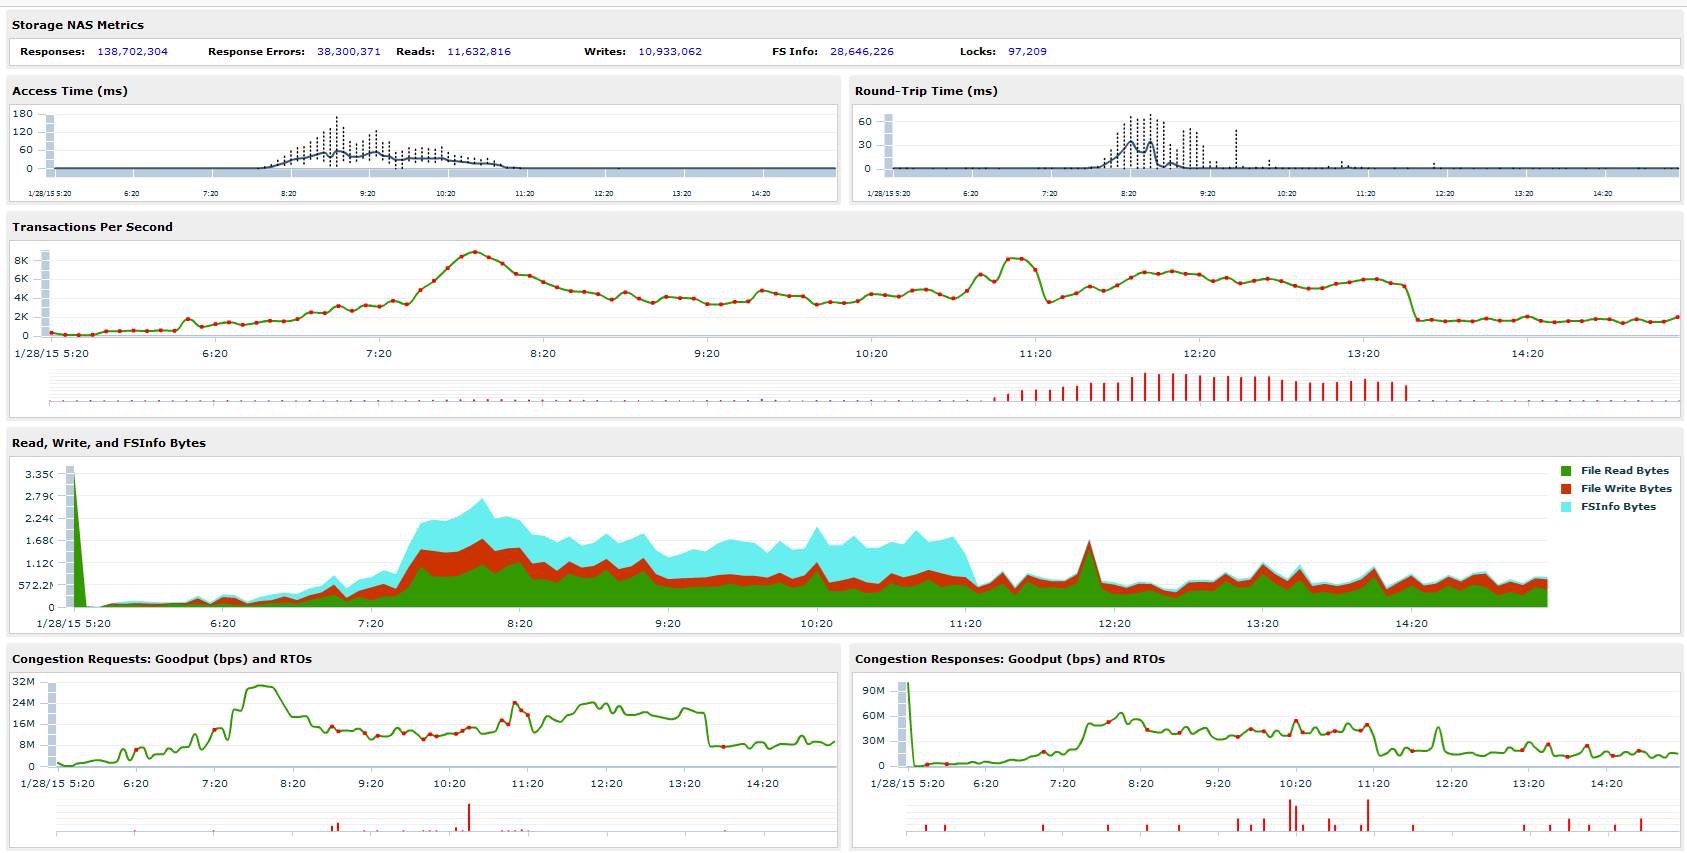
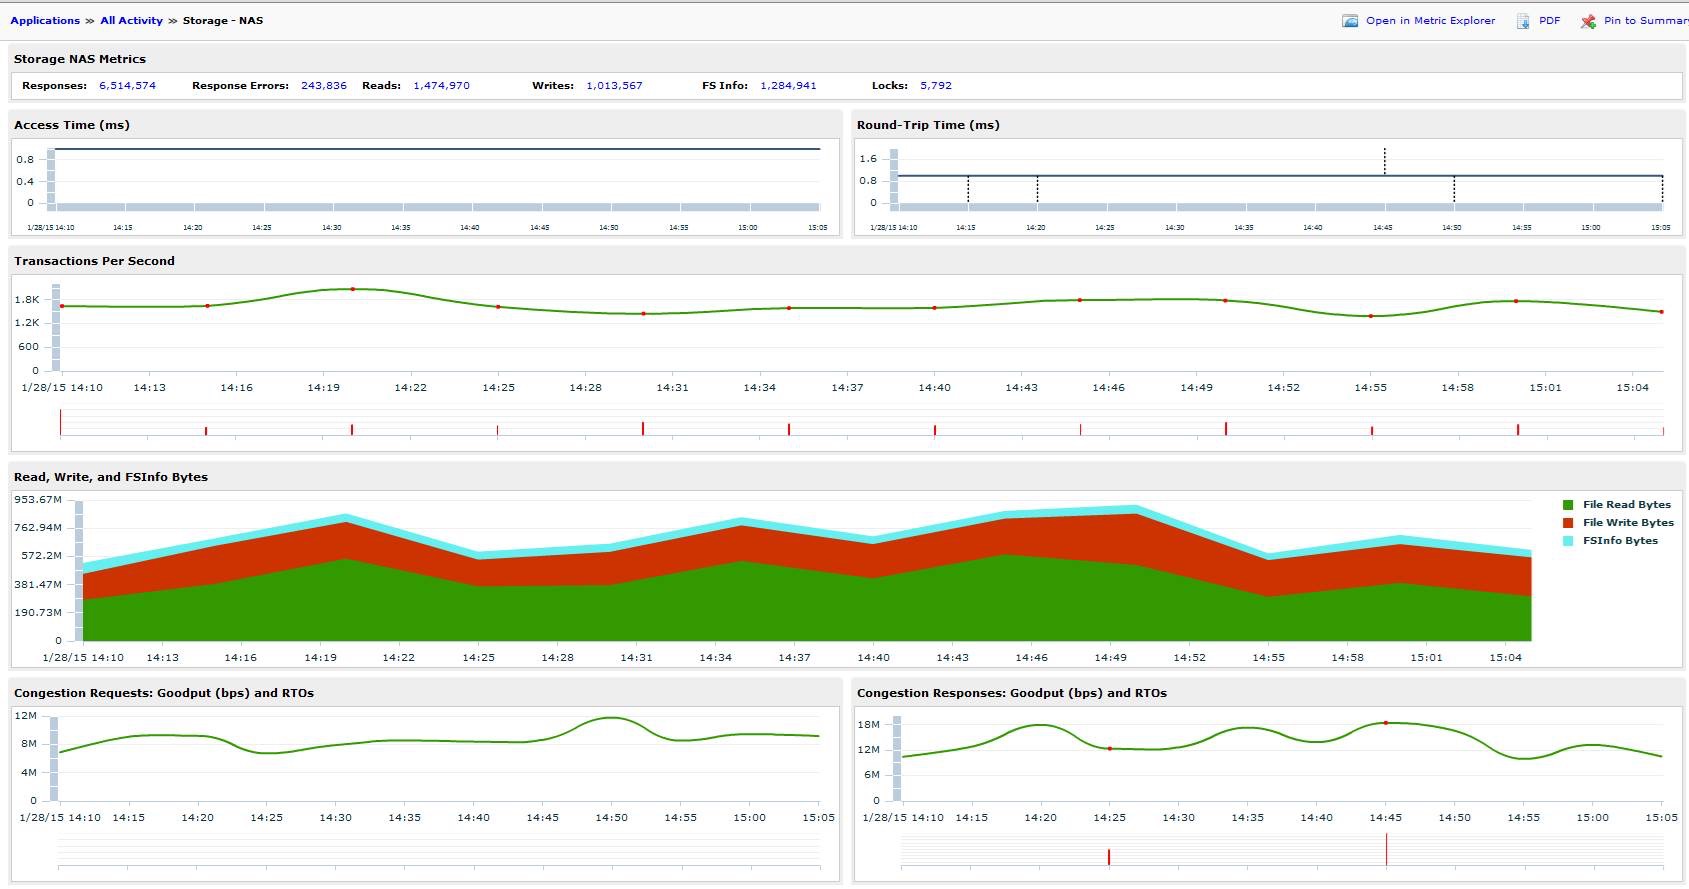
Here’s all of today’s data. The dip at 1:35 under Transactions Per Second section was me using the tool to determine that a bunch of error logs had incorrect permissions. I fixed the permissions, and the errors dropped WAY down. You can also see the access times from about 7:30 – 11am are pretty poor, but after making the change outlined above, are nearly non-existent.
Here are some additional graphs, zoomed in a bit more.
This morning during folder migrations:

This morning at the time of the mirroring change (look at the blue in the bottom graph):
And here’s the last hour:
System performance is MUCH improved (check the access times in each of those graphs).
Having the right tools to see the environment and gather the correct data makes troubleshooting much easier. I would not have been able to find and remediate this issue without a tool like ExtraHop on my network. Also, test your changes before pushing to production, and have some place that you can record those changes, so other sets of eyes can look at them and ask you if that was what caused the network to break =).
~Tim


